Let’s look at the MLB top ten third basemen for 2021, minimum 250 plate appearances. Included in the table is the NFBC Draft Champions ADP for the most recent 30 days (40 DC drafts).
| ADP | G | PA | HR | R | RBI | SB | BB% | K% | ISO | BABIP | AVG | OBP | SLG | wRC+ | |
| 1 | 3.75 | 152 | 636 | 36 | 111 | 103 | 27 | 11.30% | 13.70% | 0.272 | 0.256 | 0.266 | 0.355 | 0.538 | 137 |
| 2 | 65 | 160 | 662 | 33 | 91 | 107 | 0 | 7.90% | 25.40% | 0.227 | 0.368 | 0.303 | 0.367 | 0.531 | 135 |
| 3 | 18 | 156 | 664 | 38 | 101 | 113 | 5 | 9.30% | 21.50% | 0.259 | 0.307 | 0.279 | 0.352 | 0.538 | 134 |
| 4 | 176 | 151 | 612 | 27 | 87 | 87 | 3 | 10.00% | 16.00% | 0.193 | 0.292 | 0.278 | 0.361 | 0.471 | 127 |
| 5 | 210 | 135 | 543 | 26 | 73 | 72 | 0 | 13.60% | 21.00% | 0.228 | 0.268 | 0.247 | 0.352 | 0.475 | 124 |
| 6 | 101 | 144 | 586 | 25 | 86 | 73 | 10 | 10.60% | 23.00% | 0.216 | 0.313 | 0.265 | 0.353 | 0.481 | 123 |
| 7 | 361 | 81 | 291 | 13 | 45 | 46 | 1 | 12.00% | 23.40% | 0.221 | 0.305 | 0.261 | 0.351 | 0.482 | 123 |
| 8 | 153 | 144 | 616 | 14 | 74 | 61 | 3 | 13.60% | 25.50% | 0.148 | 0.35 | 0.263 | 0.375 | 0.412 | 122 |
| 9 | 23 | 153 | 640 | 28 | 92 | 106 | 12 | 9.80% | 15.90% | 0.211 | 0.29 | 0.278 | 0.347 | 0.489 | 122 |
| 10 | 207 | 149 | 626 | 16 | 75 | 67 | 0 | 10.40% | 21.60% | 0.172 | 0.333 | 0.271 | 0.351 | 0.443 | 119 |
What is clear at a first glance is the importance of SBs. I am not revealing a big secret by naming Jose Ramirez as the first 3B off the board, with an ADP of 3 or 4. At ADP 23 we have Manny Machado, whose SBs and low K rate, along with elite Statcast numbers, keep him solidly in the top 2 rounds of 15-team fantasy drafts. Y’all also love Rafael Devers with an ADP of 18. Thirty-eight HR and elite Statcast data justify his spot, if one is willing to take just a likely handful of SBs. After Machado and Devers there is the special case of Adalberto Mondesi at ADP 57 prior to the next guy on the list: Austin Riley at ADP 65. He is Rafael Devers, but with zero SBs and a higher K rate; I think I take Riley ten times out of ten if I could pass on Devers and guarantee getting Riley. I could keep naming guys, but let’s dispense with that and just summarize the listed and non-listed guys with stating that 3B gets kind of mushy after Riley, and if one misses out the top end, then pick your favorite bounce back guy or boring veteran; or roll the dice on a young guy. So here is the table, with names, and a longer look at Mr. ADP 361, Evan Longoria.
| ADP | G | PA | HR | R | RBI | SB | BB% | K% | ISO | BABIP | AVG | OBP | SLG | wRC+ | |
| Jose Ramirez | 3.75 | 152 | 636 | 36 | 111 | 103 | 27 | 11.30% | 13.70% | 0.272 | 0.256 | 0.266 | 0.355 | 0.538 | 137 |
| Austin Riley | 65 | 160 | 662 | 33 | 91 | 107 | 0 | 7.90% | 25.40% | 0.227 | 0.368 | 0.303 | 0.367 | 0.531 | 135 |
| Rafael Devers | 18 | 156 | 664 | 38 | 101 | 113 | 5 | 9.30% | 21.50% | 0.259 | 0.307 | 0.279 | 0.352 | 0.538 | 134 |
| Justin Turner | 176 | 151 | 612 | 27 | 87 | 87 | 3 | 10.00% | 16.00% | 0.193 | 0.292 | 0.278 | 0.361 | 0.471 | 127 |
| Josh Donaldson | 210 | 135 | 543 | 26 | 73 | 72 | 0 | 13.60% | 21.00% | 0.228 | 0.268 | 0.247 | 0.352 | 0.475 | 124 |
| Kris Bryant | 101 | 144 | 586 | 25 | 86 | 73 | 10 | 10.60% | 23.00% | 0.216 | 0.313 | 0.265 | 0.353 | 0.481 | 123 |
| Evan Longoria | 361 | 81 | 291 | 13 | 45 | 46 | 1 | 12.00% | 23.40% | 0.221 | 0.305 | 0.261 | 0.351 | 0.482 | 123 |
| Yoan Moncada | 153 | 144 | 616 | 14 | 74 | 61 | 3 | 13.60% | 25.50% | 0.148 | 0.35 | 0.263 | 0.375 | 0.412 | 122 |
| Manny Machado | 23 | 153 | 640 | 28 | 92 | 106 | 12 | 9.80% | 15.90% | 0.211 | 0.29 | 0.278 | 0.347 | 0.489 | 122 |
| Jeimer Candelario | 207 | 149 | 626 | 16 | 75 | 67 | 0 | 10.40% | 21.60% | 0.172 | 0.333 | 0.271 | 0.351 | 0.443 | 119 |
First off, Justin Turner? He’s still good. As is Josh Donaldson. Also good, and seemingly a statistical doppelganger for his erstwhile teammate Kris Bryant is Evan Longoria. Bryant is young(-ish) and should steal a few bags, plus has OF eligibility, so his ADP is more or less appropriate (opinions will differ, but he is in the right ballpark). But why are eternal injury risks Turner and Donaldson going 150 to 200 picks ahead of Longoria? The short version of the answer: projection systems hate Longoria. But should they, and how much does that matter (even if they should)?
The Steamer 600 projections at Fangraphs spits out a .273 (BA) / 23 (HR) / 79 (R) / 84 (RBI) line for Turner (122 WRC+); Donaldson: .249 / 29 / 86 / 83 (128 WRC+); Longoria: .247 / 23 / 70 / 77 (107 WRC+). Steamer projects repeat performances for JT and JD, and a regression to 2017-2021 production for Longo. Longoria last surpassed a 120 WRC+ in 2017 (123), and projection systems take that into account (I don’t know how far back any projection systems take into account, but 2017 was Longoria’s only WRC+ greater than 109 since 2013.)
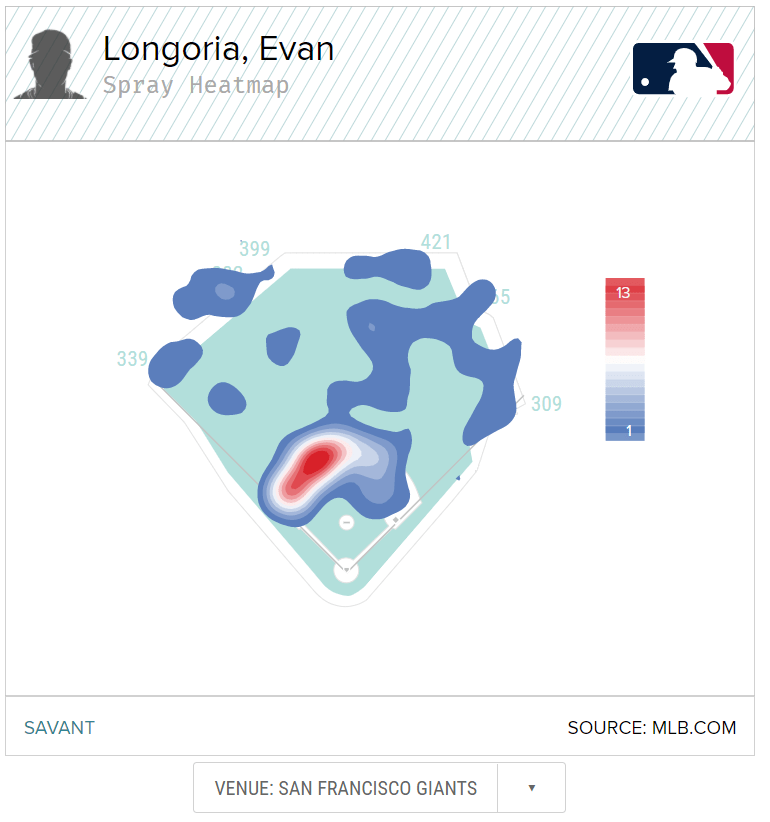
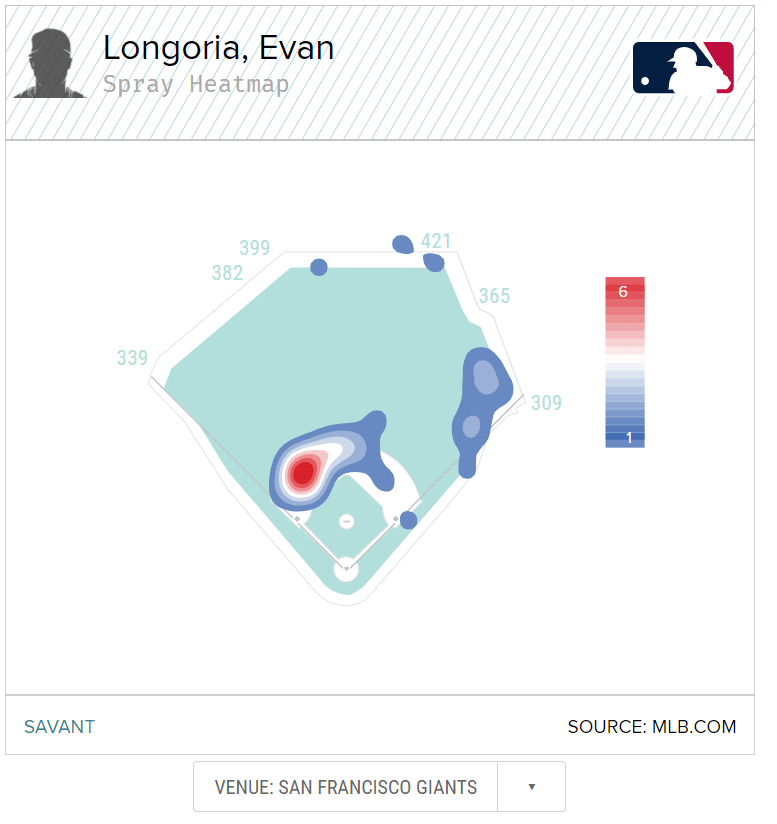
But Longoria was a different, better, hitter last year than in his other recent past: second-best walk rate of his career, and a career-low chase rate (22.5% OSwing). His called strikes plus wiffs (CSW%) was in line with his career norms, but without doing the deepest of deep dives, it seems clear that he was swinging at pitches he could punish, and he was mostly succeeding (he had easily his highest average exit velocity (94.1 mph) and max EV (113.2) of the Statcast era. Setting the minimum number of batted ball events to include Longoria and he is tied with Donaldson for fourth in MLB for average EV. For flyball/line drive EV he was “only” 26th. Whatever adjustments he and the Giants made prior to 2021, they worked.
The argument against picking Longoria much earlier? The mediocrity of 2018-2020? We can’t erase that – but again: he wasn’t that hitter last year, so how much should expectations be regressed to his recent norms? He’s injury prone? Not particularly, and certainly no more so than Donaldson and Turner (Longoria’s big chunk of missed time in 2021 (58 games) was due to a fluke injury – a collision with Brandon Crawford) (he also missed about two weeks with a “sore hand” – a bit nebulous, and troubling). His injury risk is probably average for a 36-year-old. Playing time? Sure, the Giants will Giant (mix and match / platoon), but in 2021 he played in 81 of the available 91 games that he wasn’t on the IL (he started just 67), but that was without the benefit of the DH in the National League. His expected playing time seems a pretty good match for Donaldson or Turner, but projection systems all project more than 100 more PAs for JD and JT. Basically, I don’t get it.
And there may be one more reason to bump Longoria way up your draft board. Through September 16th he had .296 BA and a .948 OPS. .948!!! He ended the season in an epic slump that brought his BA down to .261 and his OPS down to .833. There was seemingly no injury involved in the slump (maybe the sore hand was still an issue?) – but it was a real, massive, slump, and despite maintaining an average EV of 94 mph, it was mostly deserved: through 9/16, his xwoba was 0.383 and after 9/16: 0.196; and his K rate went from 21% to 36%. Longoria seemed to get more on track by the last couple days of the season, and he looked mostly ok against tough pitching in the NLDS versus the Dodgers (including that massive HR versus Max Scherzer).
We can’t ignore the projections. But in Longoria’s case I think they mostly just point out the risk, and completely ignore the upside. I am not projecting him for 600 PAs, but even with 500-550 PAs he could get to 25 HR and exceed 160 runs+RBI, with a .260 BA.