If you have done any drafting in 2026, you’re probably of the same opinion as I am: filling five OF slots in a 15-team Roto league is challenging. It takes a plan, especially if you also fall behind at RP, Catcher, or 2B (which does have some interesting picks going in the 200s of ADP… but I digress).
I recently hit my 16th round pick in an NFBC Draft Champions (50-round draft and hold), with only two of my five OF slots filled. I had been hoping for Ramon Laureano or Dalen Lile to fall to me in Round 14, but they were picked just prior to my 14th round selection. Through round 18, I still have one of my five OF slots to fill (after nabbing an OF in round 16, as well as round 18). Let’s take a quick look at OF ADP and try to parse how this challenging market is shaking out.
In looking at the ADP for Draft Champions drafts (over the preceding four weeks, 1/3 — 2/2), 84 OFs with a minimum pick of 450 or less (the end of round 30 in a 15-team league) go after pick 198 (I’m fudging on the “pick 200” theme, as Bryan Reynolds, at ADP 198+ is going, on average, 11 picks after Jurickson Profar at pick 187+. If we limit the pool to all OFs with a minimum pick of 345 or earlier (23 rounds, generally one’s starting lineup in standard 14 hitter 9 pitcher Roto), that still totals 57 OFs. Long story short, my hitting pick 200 and still having three OF slots to fill seems to be a pretty common condition. Let’s run through that list, along with a few OFs going after pick 345 that seem viable as a possible fifth OF.
I missed out on the first group of ten, but most of them have their selling points.

Bryan Reynolds and Heliot Ramos are oatmeal, but good oatmeal, and easy value (Fangraphs auction calculator, using ATC projections, has Reynolds as OF 37 and Ramos as OF 38).
Varsho has ridiculous power for a post-200 pick, with his 40-HR potential, if you have planned for his likely low BA.
I’m generally skipping Dominguez, Barger, Abreu, and Trout (playing time concerns, platoon risk, and injury risk), but they all have huge upside potential; if you have a low-risk team at this point, click away, I suppose.
Frelick and Lile are the Spiderman meme, and project as the 57th and 52nd OF, respectively. I find myself gravitating toward Lile, as he may have more upside.
Caballero is a niche pick: SB upside and a bunch of positions (“roster spackle”). But he has a “meh” BA projection, and unsure playing time.
Here is the next batch of ten, going from around ADP 225 to ADP 265.

The break here seems to be after Laureano, and if I were tiering, I’d push him into the previous batch. I get why Jac Caglianone is going here as well, but I can’t pull the trigger on him. He and Garcia both have pretty big downside potential, for very different reasons.
Overall, this group is far scarier than the previous group, with platoon risk (Carpenter, Cowser, Grisham, Moniak), “being a Rockies player” risk (Beck) (and a twofer for Moniak: platoon and a Rockies player), and injury risk (Stanton) and concern (Santander). In my ongoing draft, I nabbed Santander, and am hoping last season just gets flushed, and with a healthy(?) shoulder he returns to 30 HR production in the middle of Toronto’s lineup.
What am I learning: If you want anything close to a sure thing for your last couple OFs… you’re not in a league that drafts 75 OFs.
On to the next ten…

Well, at least there are some full-time guys here.
In my ongoing draft, I nabbed my second share this year of Friedl at pick 261. There are some rumblings he wasn’t at 100% for the second half of last year, and he is set to lead off every day for an above average Reds lineup. With good health, he could push for a 20 HR/20 SB season. Hopefully.
The rest of this list isn’t too different from the previous ten. Some oatmeal (Lee, O’Hearn). Some mystery box SB upside (Crawford). Matt Wallner’s massive power and who knows what it will be BA. And platoons… or maybe Lowe and Mullins play most days, and hurt your BA while helping in SBs and treading water in HR. I wouldn’t want to count on that, but it may be worth the shot.
Edman and Castro offer positional flexibility, but Edman is off my board due to injury issues and unsure playing time (he’s always been much better versus LHP). If you think you can project Castro with the Rockies… maybe, but the error bars are wide; but at this ADP, or somewhat earlier, it may be an ok time to pick him as some needed roster spackle.
After ADP 300 we really start digging deep, but there is some promise in the next group, 12 players by ADP this time, as there is a small ADP break after them.

Bader is going to move up a tier or two, upon his signing for a fulltime gig with the Giants.
It is appropriate that Carter and DeLauter are adjacent, as both have high upside coupled with injury concerns.
Then we have similarities to the previous batch: lefty platoon bats (Sanchez, Canzone, Marsh), roster spackle (McKinstry), and mystery box (Walker).
McNeil and Collins both belong higher up, in my opinion if they show they deserve what seem to be fulltime roles. Robles as well, but he has greater risk, since if he loses PT he might end up being a short-side platoon / defensive replacement.
I ignore Scott, but if you only need SB at this point… God help you.
If I still need an OF at this point, I am jumping on McNeil, or taking a chance on the oatmealy Collins, if I don’t grab Bader.
The last batch. Are there any starters (fantasy, or real baseball) here?
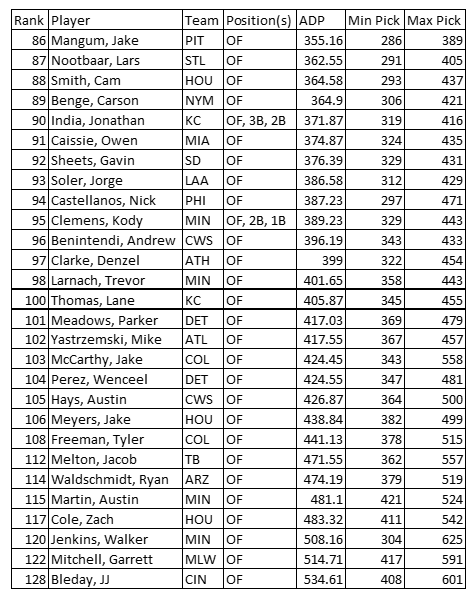
Yes! Well, probably. Mangum should play, and he may actually be good (despite a short track record). Benge is a top prospect, and he may be a starter for the Mets. Caissie is in a similar position with the Marlins. Melton might earn a fulltime role in Tampa Bay. Hays will move up a tier upon his signing with the White Sox.
And more platooners: pick your favorite, if you have one. Avoid Larnach, as he probably won’t be on the Twins. Or draft Larnach, as a change of scenery might help him?
Waldschmidt 10/10 times over Jenkins, if you are considering a rookie that may not have a job. Even if Larnach is traded, the Twins are still likely to slow play Jenkins’s callup.
Garrett Mitchell still exists. I’d take a shot at his ADP.
The true sleepers from this group are Perez and Martin. Perez could just accumulate his way to 15 HR and 15 steals. Projection systems are all totally whiffing on Martin’s SB and BA upside – if looking for SBs. Martin is ADP 481, and I’d take him straight up over Victor Scott (ADP: 336); Scott may steal 10 more bags, but Martin should well outpace Scott in BA.
As usual, in 2026, there are loads of platoon LHBs, and an assortment of promising rookies. But for my late OF picks, I’m gravitating toward the more “meh” guys who seem to have assured roles (TJ Friedl, Harrison Bader, Jeff McNeil, Austin Hays, Isaac Collins, Wenceel Perez), and taking a shot on Austin Martin late, as I think he gets more plate appearances than expected (and well out-performs projections on SBs and BA).